What is THI and how does it affect milk production
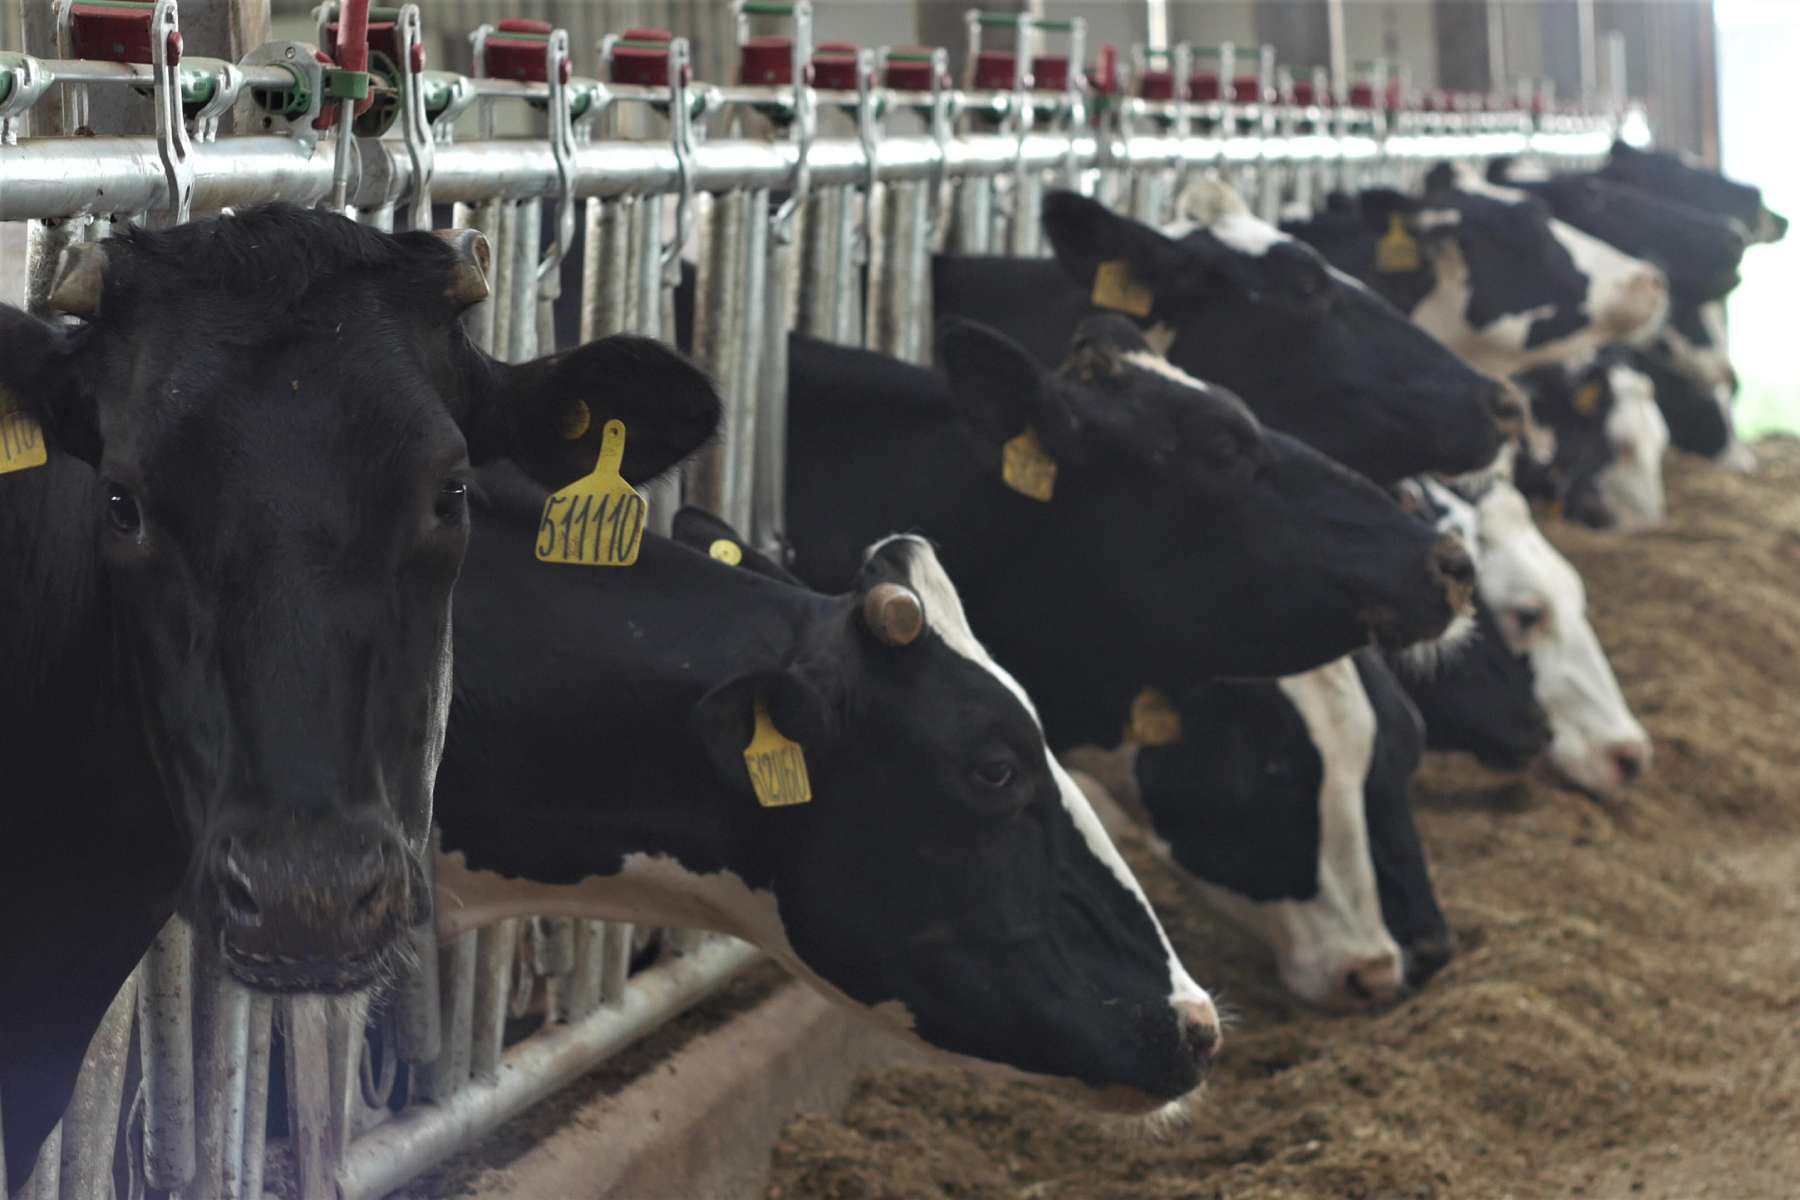
The Temperature Humidity Index (THI) is an indicator that takes into account the combined effects of ambient temperature and relative humidity and is a useful and simple way to assess the risk of heat stress.
THI is used in livestock farming, both in dairy and meat cows. Cows suffer from heat stress, which seriously affects the volume and quality of the milk they produce. This is because most of the energy received from food is used to maintain a constant body temperature, neglecting other activities such as milk production, pregnancy etc.
A combination of factors causes thermal stress: temperature, relative humidity, solar radiation, air movement and precipitation. Most studies of heat stress in livestock focus on two main environmental factors: temperature and relative humidity (RH). Therefore, we install milk producers with sensors for temperature, humidity, wind speed and so on, which allows us to obtain environmental data and identify threats in the early stages.
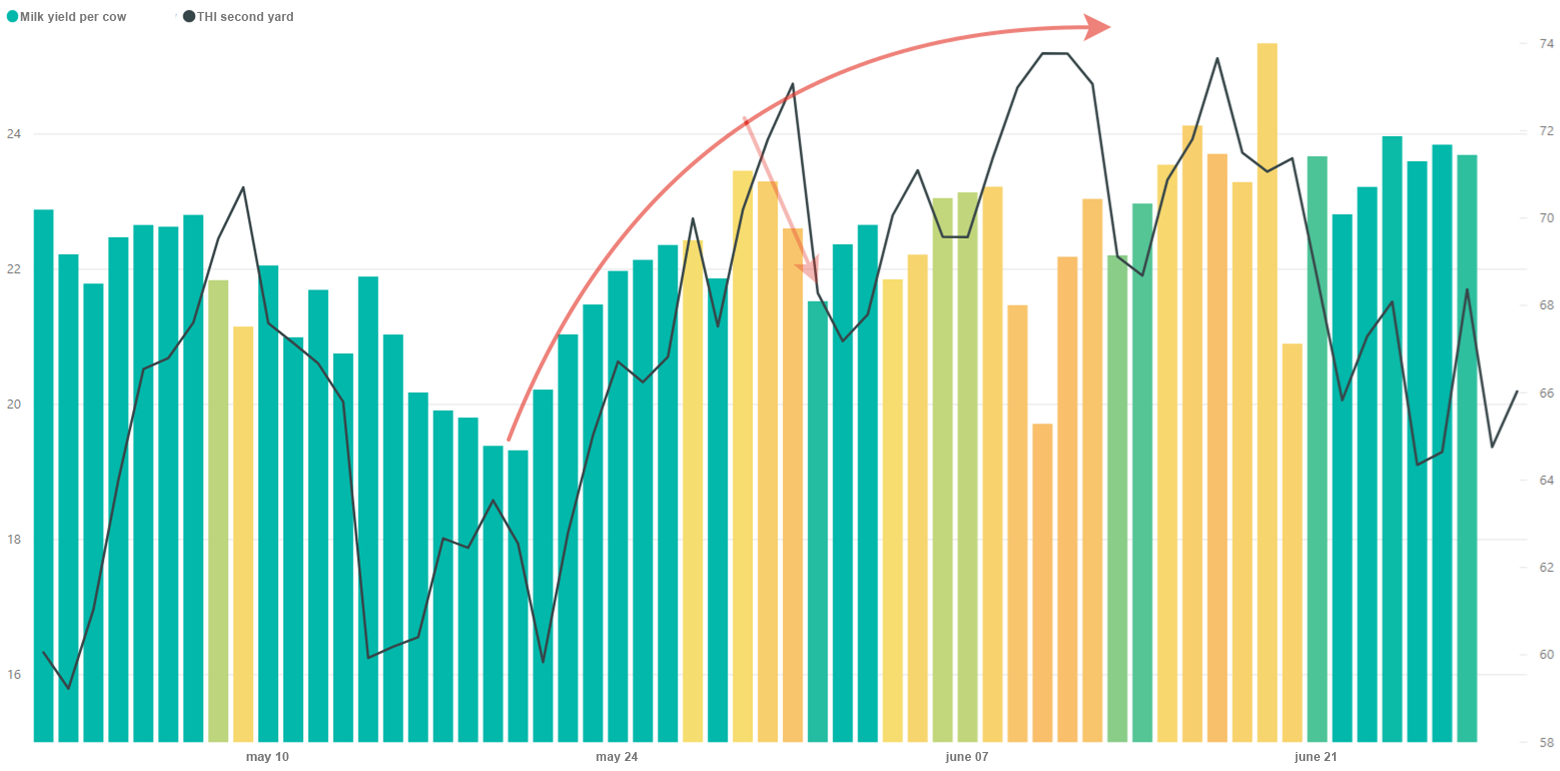
The DPA service has a specially developed report “Milking and THI”, which shows the change in milk production depending on the THI index for all yards. Each yard is indicated by a separate schedule. The bars on the graphs show milk yield by day, the color of the bar depends on the THI value, if below 69 - the bar is green, the higher than 69, the more yellow the bar, at high THI values corresponding to severe heat stress, the bar will turn red.
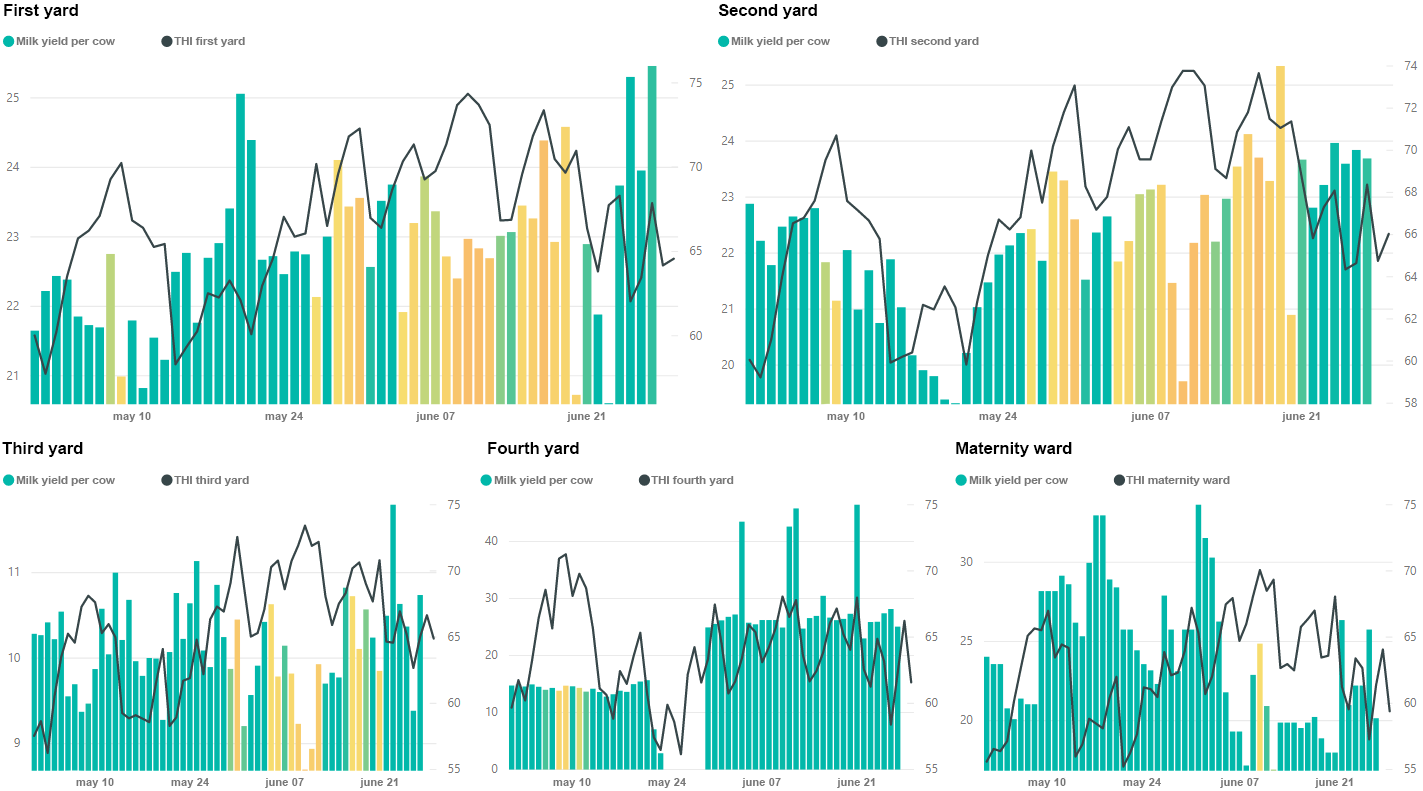
Consider a specific example of this report. The report shows that there was a significant excess of the THI index only in the first and second yards. In this case, the THI value corresponded to the values “the beginning of heat stress” (69 <THI <73). Values THI> 73 corresponding to the zone of "thermal stress" were short-lived (1-2 days). Given the effect on the milk yield of many different factors, it was difficult, but possible, to reveal a clear dependence of milk production on a slight excess of THI.
We analyze what happened in the second courtyard. In May, the farm carried out mass transfers of animals. In particular, on May 20, 47 animals were added to the second yard, most of them in the late stages of lactation from 4 yards, as well as a number of recently calving cows. On May 22, another 8 newbodies from the maternity ward were added.
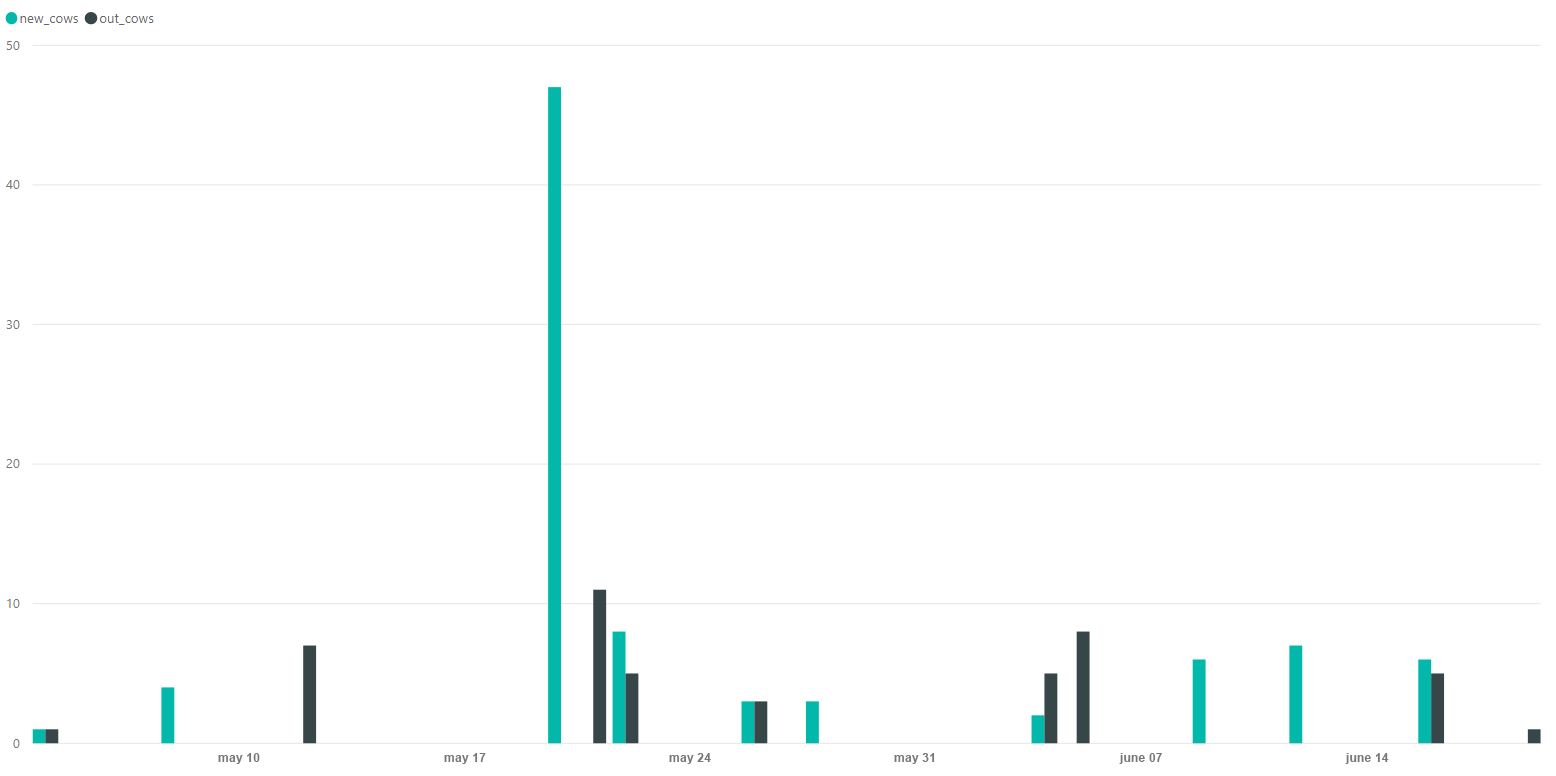
After this, the growth of milk production began, lasting until May 27. For the period from May 20 to May 27, the milk yield increased by more than 3 kilograms from 19.32 to 22.43. On May 27, the THI index reached 69.99, after which on May 28 milk yield decreased to 21.86. The transfer of 6 newbodies from the maternity ward on May 26 and 28 also contributed to this.
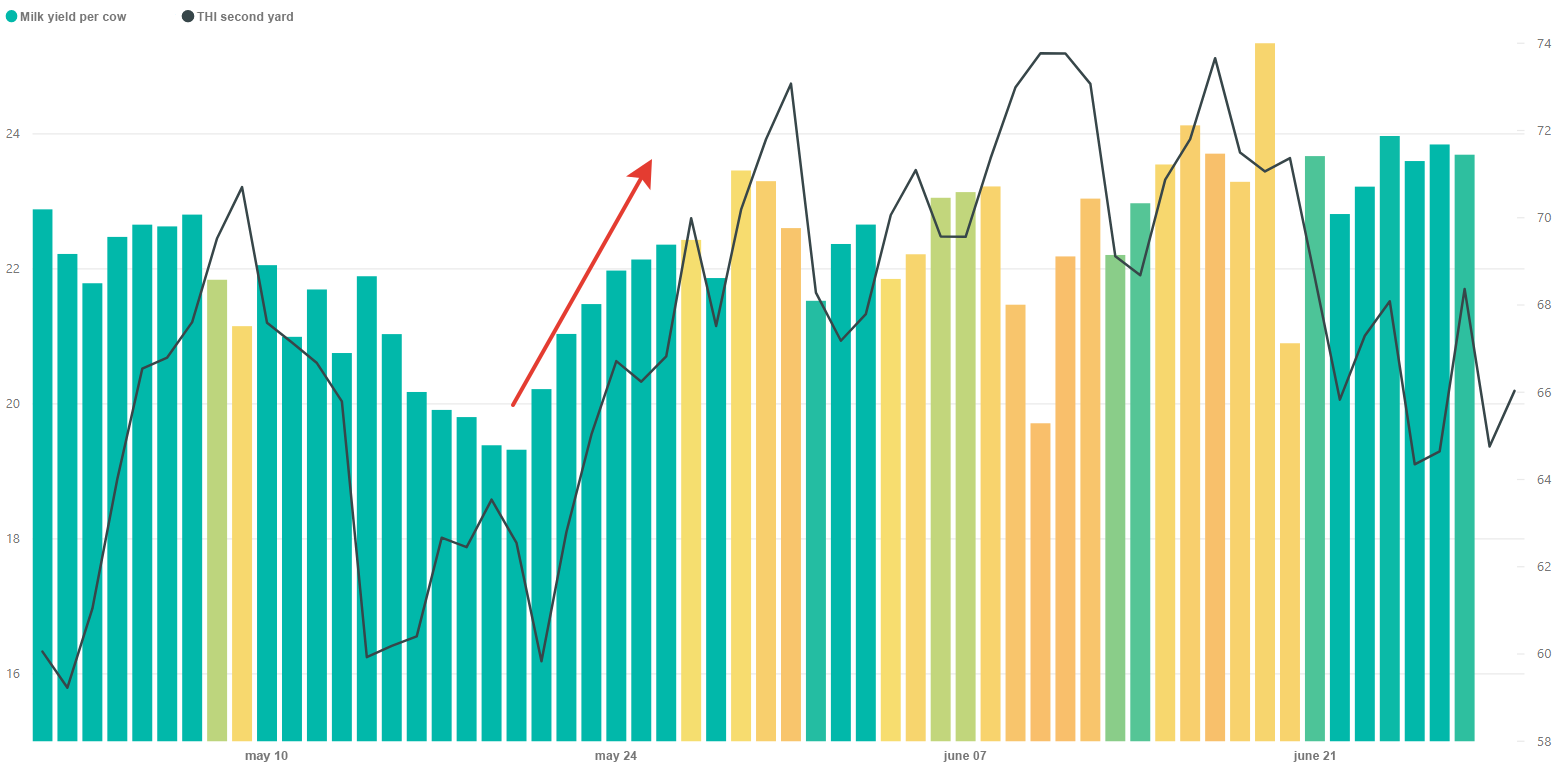
On May 29, the milk yield increased again, because On May 28th, THI was within normal limits, and the scattering of newbodies continued. However, on May 29, THI again exceeded the norm and grew until May 31, exceeding the value of 73 (corresponds to thermal stress). At the same time, milk yield from May 29 to June 1 fell from 23.46 to 21.53.
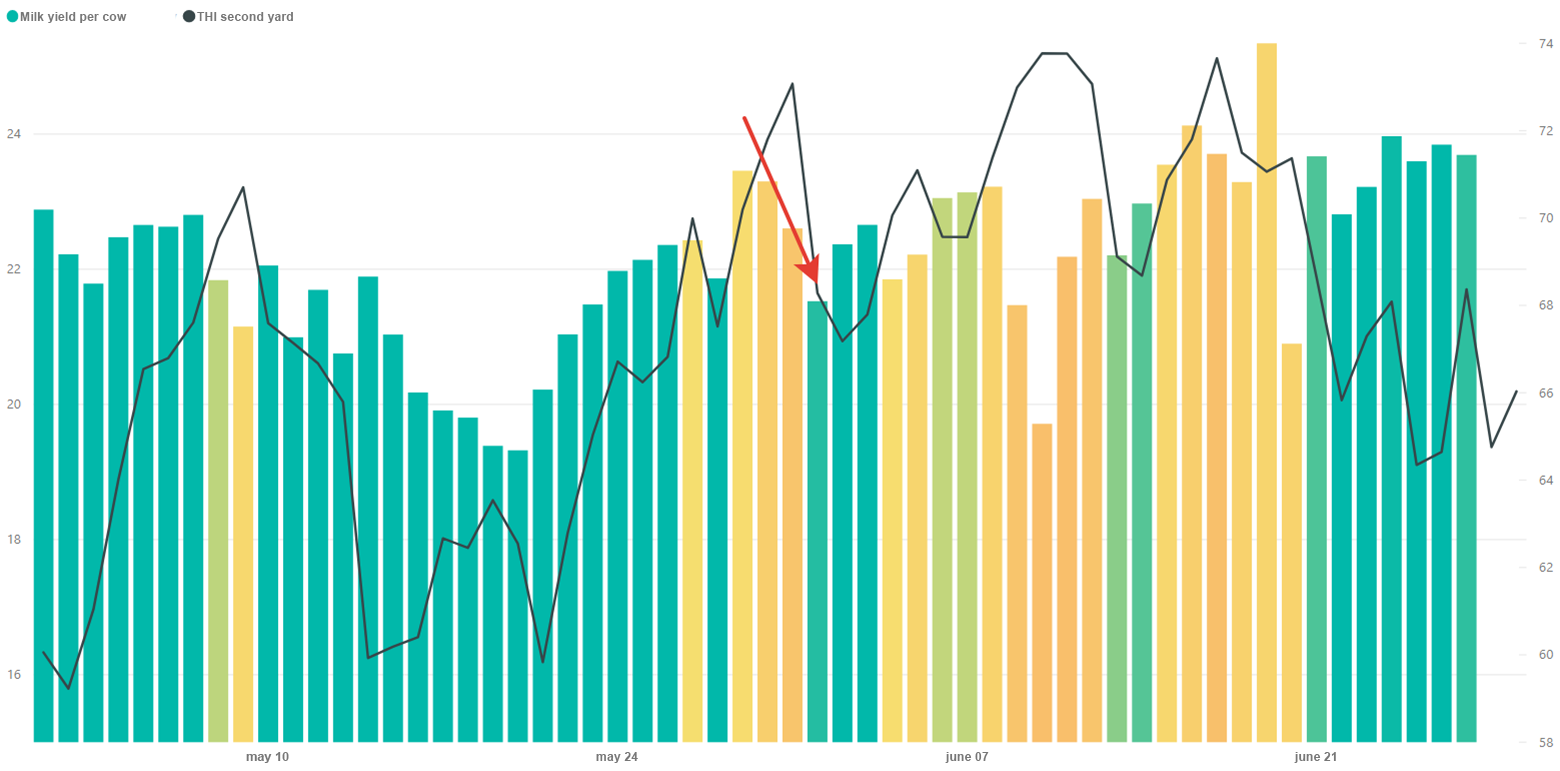
On June 1, THI again fell to normal and milk production began to rise. On June 4, 2 new callers were transferred to the second yard and 5 cows were taken to 3 and 4 yards (dim from 100 to 150). This fact, as well as an increase in THI, led to a decrease in milk yield. The minimum milk yield - 19.71 kg coincided with the maximum THI value on June 10th. Such a significant decrease was affected by mass vaccination on June 9th. In the second courtyard, all available 184 cows were vaccinated. If, excluding the influence of THI, approximate the growth that began on May 20, then we can assume that by June 10 the milk yield should have been 25 - 26 kg. In reality, due to exceeding the critical value of THI, the yield of milk before vaccination was 22-23 kg.
In this material, we have published part of our research. Follow our news.
Still have questions?
Contact us and find out more
